A
B
C
D
Text Solution
Verified by Experts
The correct Answer is:


Similar Questions
Explore conceptually related problems
Recommended Questions
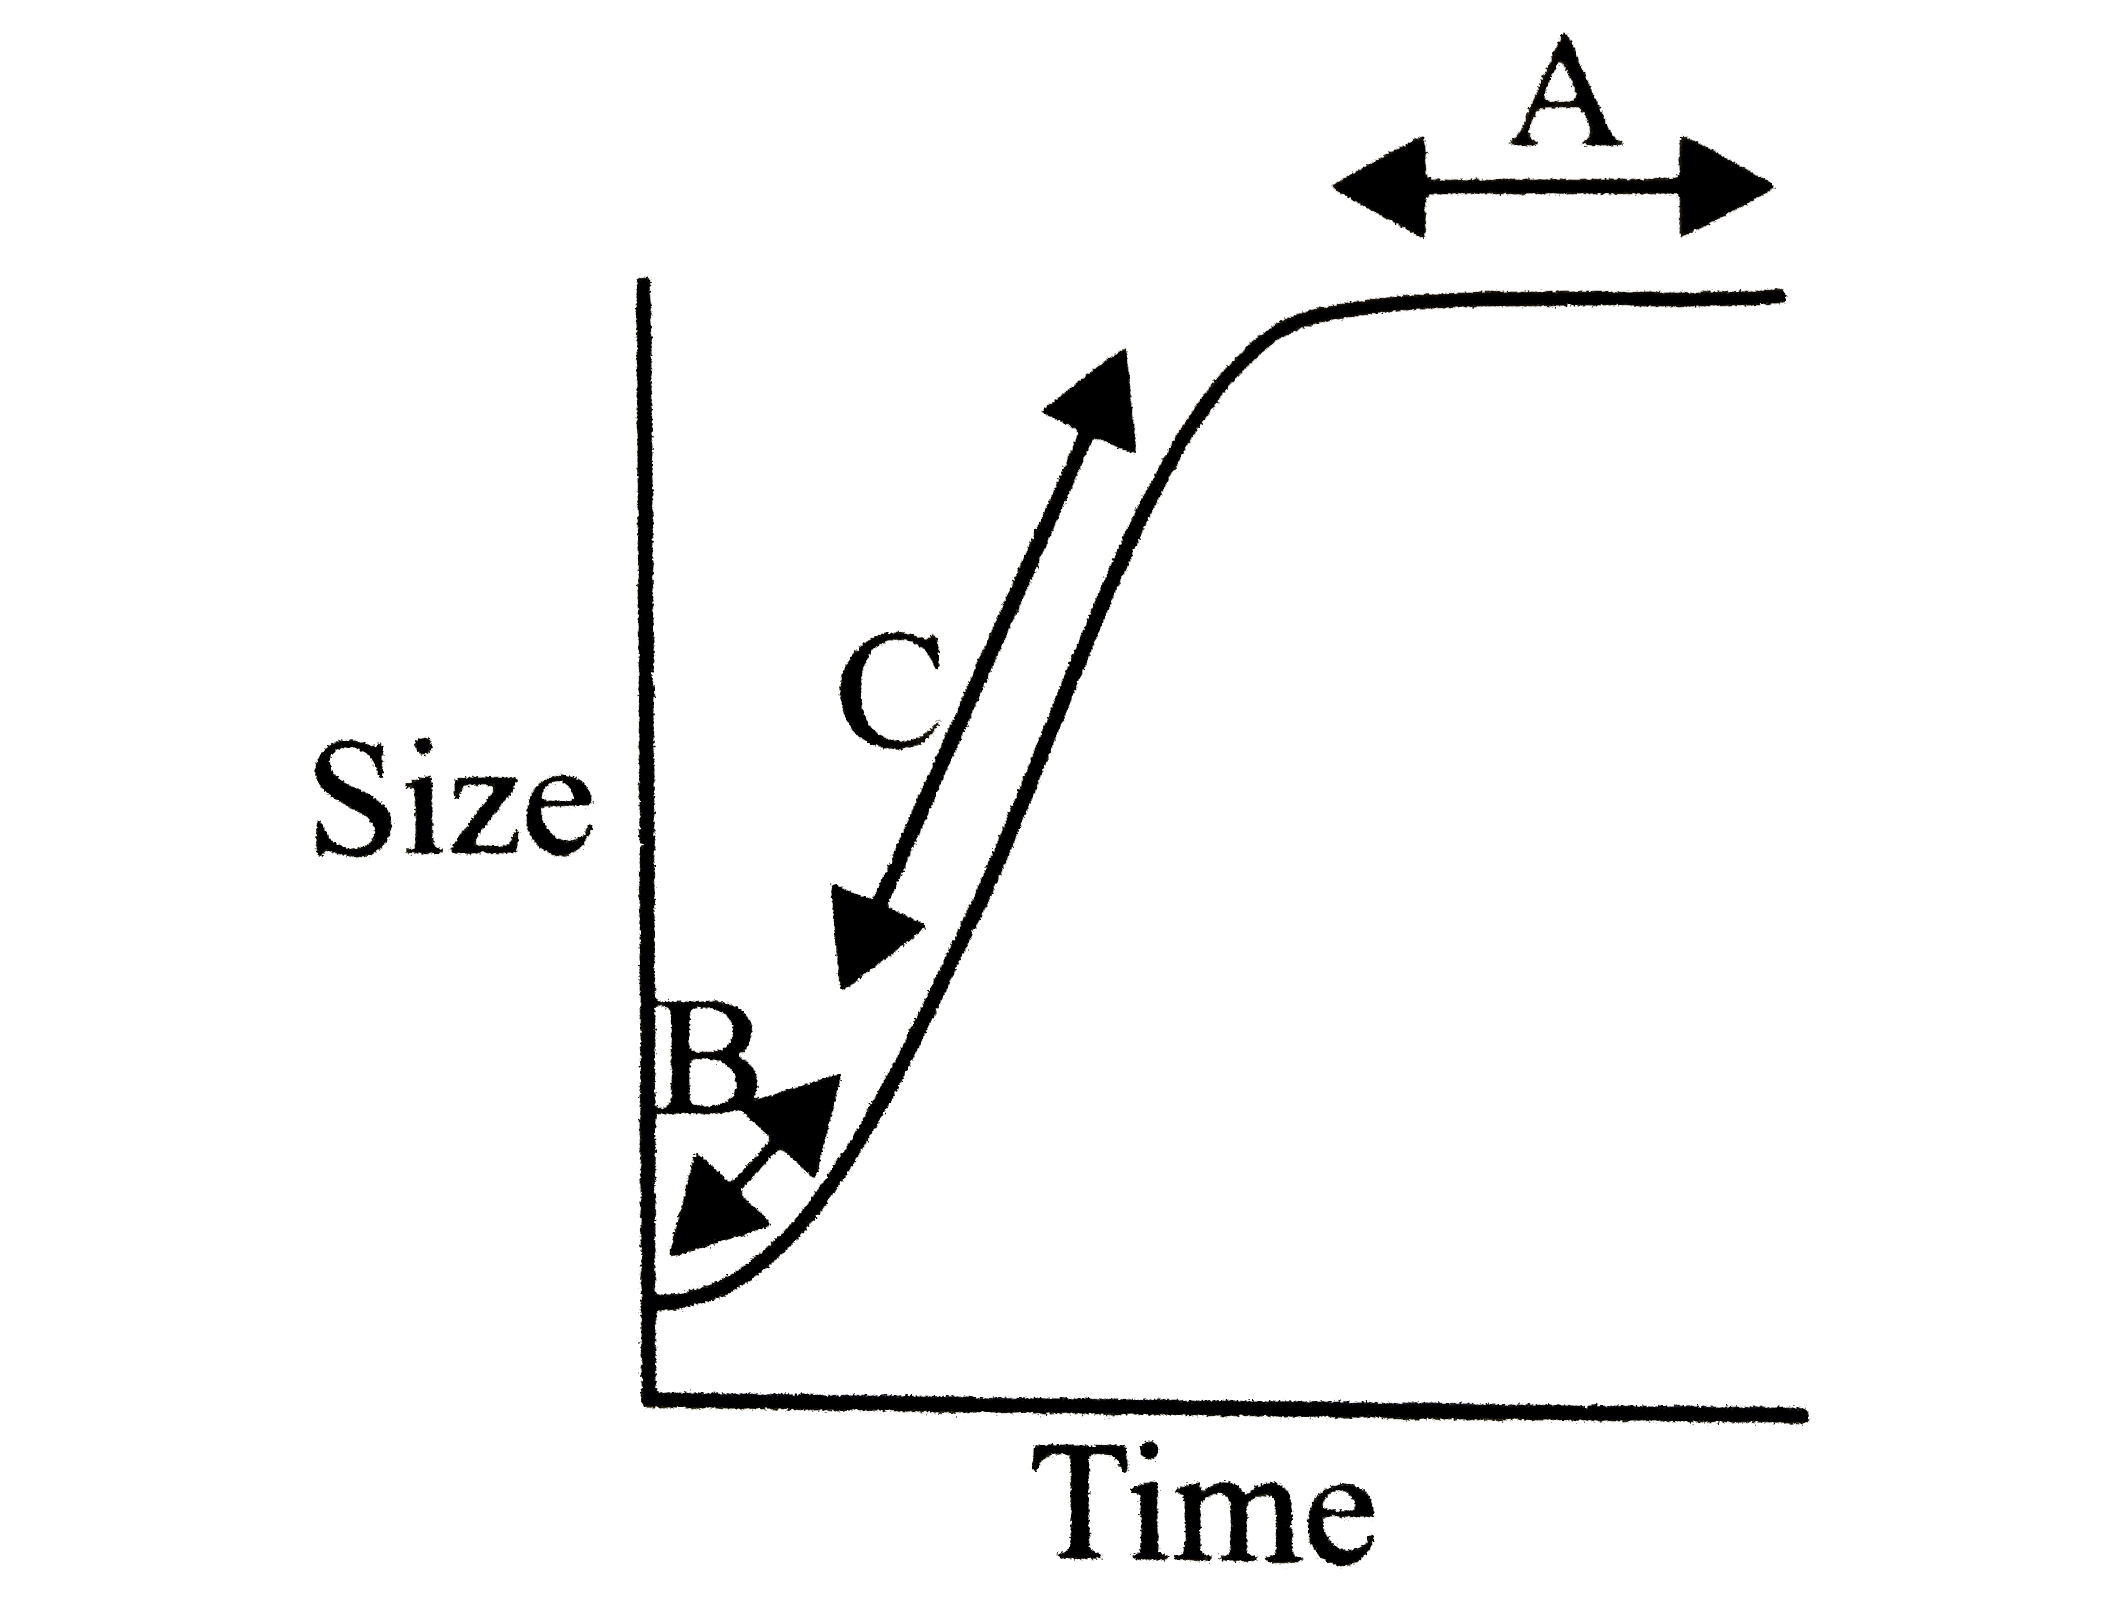
- Given graph is drawn on the parameters of growth versus time. Here A,B...
Text Solution
|
- If a graph is drawn for acceleration versus displacemnet of SHM. It is...
Text Solution
|
- A nucleus A (parent) decays into B (Daughter) with half life T(1) and ...
Text Solution
|
- The graph below shws the velocity versus time graph for a body Wh...
Text Solution
|
- The graph given below represents changes in different ecological param...
Text Solution
|
- Given below is a graph on the parametes of growth versus time A,B , C ...
Text Solution
|
- In the given velocity (V) versus time (t) graph, accelerated and decel...
Text Solution
|
- Geometric growth represents…….graph.
Text Solution
|
- The graph in figure shows the velocity v versus time t for a body. Whi...
Text Solution
|