A
B
C
D
Text Solution
Verified by Experts
The correct Answer is:


Similar Questions
Explore conceptually related problems
Recommended Questions
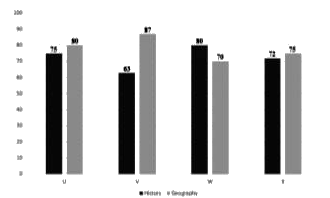
- The bar chart represents percentage marks scored by four students U, V...
Text Solution
|
- If bar(u),bar(v),bar(w) are three non coplanar vectors then (bar(u)+ba...
Text Solution
|
- The value of |[a,a+d,a+2d] , [a+d,a+2d,a+3d] , [a+2d,a+3d,a+4d]|+|[b,b...
Text Solution
|
- Match the following Column A to Column B
Text Solution
|
- The inequation represented by the graph given below is : <img src="htt...
Text Solution
|
- In the given figure, PQRS is a parallelogram. A and B are the mid-poin...
Text Solution
|
- In CH(3)CH(2)Br,% of Br is
Text Solution
|
- In CH(3)CH(2)Br,% of Br is
Text Solution
|
- माना कि सदिश bar(u), bar(v) और bar(w) इस प्रकार हैं कि bar(u)+bar(v)+b...
Text Solution
|