A
B
C
D
Text Solution
Verified by Experts
The correct Answer is:


Similar Questions
Explore conceptually related problems
Recommended Questions
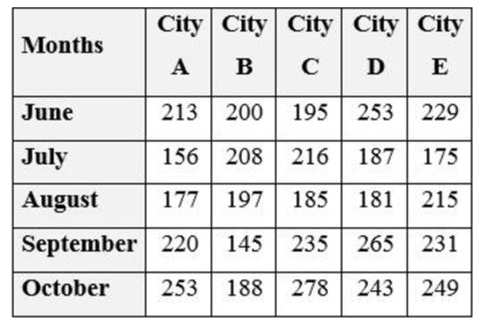
- The table below depicts the Number of Books Sold by 5 cities during 5 ...
Text Solution
|
- Read the bar graph (Fig 3.4) and answer the questions that follow:Num...
Text Solution
|
- What is the ratio of total books sold by store P and R together to th...
Text Solution
|
- Find the difference between total number of books sold on Monday and T...
Text Solution
|
- Total number of books sold on Saturday is 40% more than total number o...
Text Solution
|
- किताब-घर ने मार्च के प्रथम सप्ताह में 2,85,891 रु. मूल्य की पुस्तके बे...
Text Solution
|
- Read the bar graph which shows the number of books sold by a bookstore...
Text Solution
|
- Read the bar graph given below which shows the number of books sold by...
Text Solution
|
- Read the bar graph given below which shows the number of books sold by...
Text Solution
|