A
B
C
D
Text Solution
Verified by Experts
The correct Answer is:


Similar Questions
Explore conceptually related problems
Recommended Questions
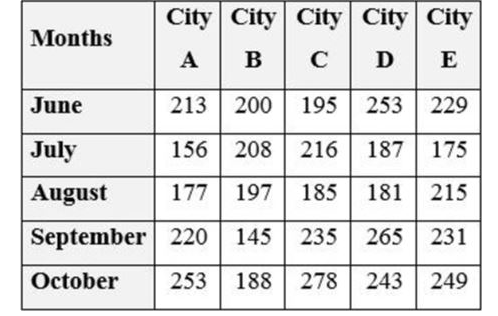
- The table below depicts the Number of Books Sold by 5 cities during 5 ...
Text Solution
|
- Match the following Column A to Column B
Text Solution
|
- The inequation represented by the graph given below is : <img src="htt...
Text Solution
|
- The inequation that best describes the graph given below is <img src=...
Text Solution
|
- In the given figure, PQRS is a parallelogram. A and B are the mid-poin...
Text Solution
|
- What is the ratio of total books sold by store P and R together to th...
Text Solution
|
- Find the difference between total number of books sold on Monday and T...
Text Solution
|
- Total number of books sold on Saturday is 40% more than total number o...
Text Solution
|
- Total number of books sold on Tuesday are 25% more than total number o...
Text Solution
|