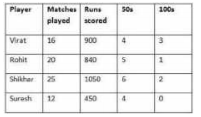
 What is the average of the total number of runs scored by all four batsman together?
 A
B
C
D
Text Solution
Verified by Experts
The correct Answer is:


Similar Questions
Explore conceptually related problems
Recommended Questions
- The Table shows the number of T-20 matches played, runs scored, 50s an...
Text Solution
|
- A batsman scored the following number of runs in six innings:36, 35, ...
Text Solution
|
- एक बल्लेबाज़ के 110 रन बनाए जसमे 3 चौके तथा 8 छक्के शामिल थे, तो उसने क...
Text Solution
|
- Determine the point of symmetry of a regular hexagon. <img src="htt...
Text Solution
|
- Match the following Column A to Column B
Text Solution
|
- Match the following Column A to Column B
Text Solution
|
- The inequation represented by the graph given below is : <img src="htt...
Text Solution
|
- The inequation that best describes the graph given below is <img src=...
Text Solution
|
- The inequation that best describes the following graph is <img src="h...
Text Solution
|