A
B
C
D
Text Solution
Verified by Experts
The correct Answer is:


Similar Questions
Explore conceptually related problems
Recommended Questions
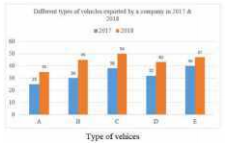
- The given Bar Graph presents the number of different types of vehicles...
Text Solution
|
- The inequation represented by the graph given below is : <img src="htt...
Text Solution
|
- The inequation that best describes the graph given below is <img src=...
Text Solution
|
- The given Bar Graph presents the number of different types of vehicles...
Text Solution
|
- The given Bar Graph presents the number of different types of vehicles...
Text Solution
|
- In given bar graph presents the number of different types of vehicles ...
Text Solution
|
- The average number of type A,B and D vehicles exported in 2015 was x%...
Text Solution
|
- The given bar graph presents Different type of Vehicles exported by a ...
Text Solution
|
- The given bar graph presents Different type of Vehicles exported by a ...
Text Solution
|