A
B
C
D
Text Solution
Verified by Experts
The correct Answer is:


Similar Questions
Explore conceptually related problems
Recommended Questions
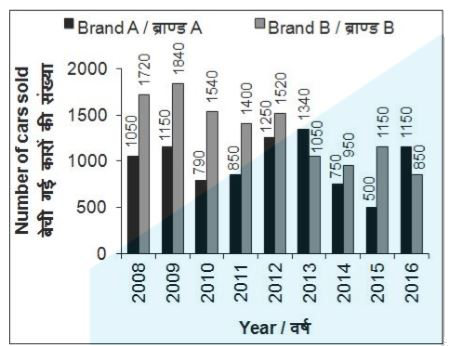
- The bar chart given below shows the number of cars sold by brand A and...
Text Solution
|
- Match the following Column A to Column B
Text Solution
|
- The inequation represented by the graph given below is : <img src="htt...
Text Solution
|
- The inequation that best describes the graph given below is <img src=...
Text Solution
|
- The bar chart given below shows the sales (in '000 units) of 4 mobile ...
Text Solution
|
- The given pie chart represents the distribution of the percentage of s...
Text Solution
|
- The bar chart given below shows the sales (in '000 units) of 4 mobile ...
Text Solution
|
- The given pie-chart shows the distribution (in degrees) of cars sold o...
Text Solution
|
- The given bar graph shows the number of cars sold from Jan to Dec. How...
Text Solution
|