A
B
C
D
Text Solution
Verified by Experts
The correct Answer is:


Similar Questions
Explore conceptually related problems
Recommended Questions
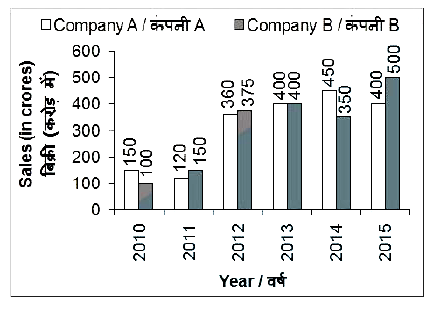
- The bar chart given below shows the sales (in crores) of 2 companies A...
Text Solution
|
- The inequation represented by the graph given below is : <img src="htt...
Text Solution
|
- The inequation that best describes the graph given below is <img src=...
Text Solution
|
- The bar chart given below shows the revenue (in Rs. crores) of company...
Text Solution
|
- The line graph shows the Sales per employee of a certain company. Stud...
Text Solution
|
- The line chart given below shows the sales (in crores) of company A an...
Text Solution
|
- The line chart given below shows the sales (in crores) of company A an...
Text Solution
|
- The bar chart given below shows the sales ( in crores) of company P fr...
Text Solution
|
- The bar chart given below shows the sales ( in crores ) of company P f...
Text Solution
|