A
B
C
D
Text Solution
Verified by Experts
The correct Answer is:


Similar Questions
Explore conceptually related problems
Recommended Questions
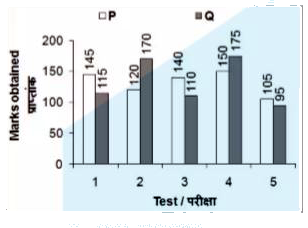
- The bar chart given below shows the marks obtained by P and Q in 5 tes...
Text Solution
|
- The marks (maximum marks 100) obtained by 20 students in a test are gi...
Text Solution
|
- The percentage of marks obtained by a student in a monthly test is as ...
Text Solution
|
- Match the following Column A to Column B
Text Solution
|
- The inequation represented by the graph given below is : <img src="htt...
Text Solution
|
- The inequation that best describes the graph given below is <img src=...
Text Solution
|
- The percentage of marks obtained by a student in the monthly unit test...
Text Solution
|
- The table given below shows the marks obtained by six students in 5 di...
Text Solution
|
- The pie-chart given below shows marks obtained by Aman in 5 subjects. ...
Text Solution
|