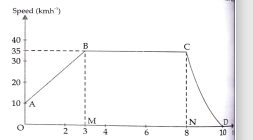
 Which part of the graph shows vary retardation?


Topper's Solved these Questions
Similar Questions
Explore conceptually related problems
MODERN PUBLICATION-MOTION-EXAMPLE
- The graph below shows how the speed car changes with time: What is t...
Text Solution
|
- The graph below shows how the speed car changes with time: Which par...
Text Solution
|
- The graph below shows how the speed car changes with time: Which pa...
Text Solution
|
- A farmer moves along the boundary of a square field of side 10 m in 40...
Text Solution
|
- Rajeev went from Delhi to Chandigarh on his motorbike. The odometer of...
Text Solution
|
- A cyclist goes around a circular track of diameter 105 m in 5 min. Cal...
Text Solution
|
- Why is it advised to tie any luggage kept on the roof of a bus with ro...
Text Solution
|
- A car is moving with a velocity of 72km/h. By applying brakes a negati...
Text Solution
|
- A girl drove to a hospital from her home and noted the odometer readin...
Text Solution
|
- A girl drove to a hospital from her home and noted the odometer readin...
Text Solution
|
- Give one example of motion where an object does not change its speed b...
Text Solution
|
- In a along distance race, the athletes were expected to take four roun...
Text Solution
|
- In a along distance race, the athletes were expected to take four roun...
Text Solution
|
- In a along distance race, the athletes were expected to take four roun...
Text Solution
|
- In a along distance race, the athletes were expected to take four roun...
Text Solution
|
- Is instantaneous speed and average speed same physical quantities?
Text Solution
|
- Can distance-time graph of this nature of this anture be possesed
Text Solution
|
- Do the following graphs represent the same type of motion?
Text Solution
|
- Do the following graphs represent the same type of motion?
Text Solution
|
- Are the following graphs possible
Text Solution
|