A
B
C
D
Text Solution
Verified by Experts


Topper's Solved these Questions
Similar Questions
Explore conceptually related problems
CBSE MODEL PAPER-SAMPLE PAPER 2022-ALTERNATIVE QUESTIONS(SECTION B)
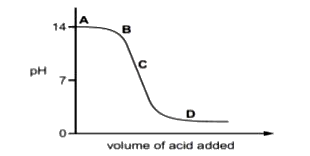
- The graph given below depicts a neutralization reaction (acid + alkali...
Text Solution
|
- Even though rain water is the purest form of water, it acts as an elec...
Text Solution
|
- The reason for different behaviour (floating) of Mg in dil HCl is due ...
Text Solution
|
- Which of the following solutions are electrolytes? i. Dil. HCl ii....
Text Solution
|