A
B
C
D
Text Solution
Verified by Experts
The correct Answer is:


Similar Questions
Explore conceptually related problems
Recommended Questions
- The given pie-chart represents the distribution of the percentage of s...
Text Solution
|
- The table shows the number of cars sold by three showrooms over a peri...
Text Solution
|
- The table shows the number of cars sold by three showrooms over a peri...
Text Solution
|
- The given pie chart represents the distribution of the percentage of s...
Text Solution
|
- This table shows the number of cars sold in different showrooms during...
Text Solution
|
- By what percent the total number of cars sold by all the showrooms in ...
Text Solution
|
- The given pie-chart shows the distribution of sales of a specific bran...
Text Solution
|
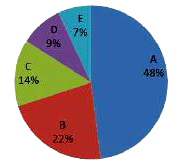
- Identify A,B,C and D,E <img src="https://d10lpgp6xz60nq.cloudfront.net...
Text Solution
|
- The given pie-chart shows the distribution (in degrees) of cars sold o...
Text Solution
|