A
B
C
D
Text Solution
Verified by Experts
The correct Answer is:


Similar Questions
Explore conceptually related problems
Recommended Questions
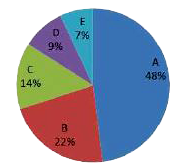
- The given pie-chart represents the distribution of the percentage of s...
Text Solution
|
- Match the following Column A to Column B
Text Solution
|
- The inequation represented by the graph given below is : <img src="htt...
Text Solution
|
- The table shows the number of cars sold by three showrooms over a peri...
Text Solution
|
- The table shows the number of cars sold by three showrooms over a peri...
Text Solution
|
- The given pie chart represents the distribution of the percentage of s...
Text Solution
|
- The given pie chart represents the distribution of the percentage of s...
Text Solution
|
- This table shows the number of cars sold in different showrooms during...
Text Solution
|
- By what percent the total number of cars sold by all the showrooms in ...
Text Solution
|