A
B
C
D
Text Solution
Verified by Experts
The correct Answer is:


Similar Questions
Explore conceptually related problems
Recommended Questions
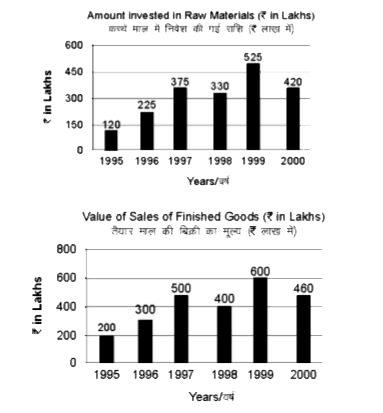
- Out of the bar graphs provided below one shows the amount invested a ...
Text Solution
|
- Directions (Questions 27-31): Out of the bar graphs given below, on...
Text Solution
|
- In which year, the percentage change (compared to previous year) in...
Text Solution
|
- What was the difference between the average amount invested in raw ...
Text Solution
|
- The value of sales of finished goods in 2009 was approximately what...
Text Solution
|
- The maximum difference between the amount invested in raw materials...
Text Solution
|
- Study the following graph and answer the given questions दिए गए स...
Text Solution
|
- Determine the point of symmetry of a regular hexagon. <img src="htt...
Text Solution
|
- Match the following Column A to Column B
Text Solution
|