A
B
C
D
Text Solution
Verified by Experts
The correct Answer is:


Similar Questions
Explore conceptually related problems
Recommended Questions
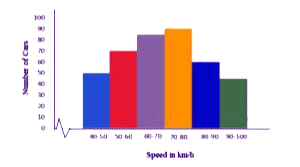
- The given histogram shows the frequency distribution of the speed of c...
Text Solution
|
- Determine the point of symmetry of a regular hexagon. <img src="htt...
Text Solution
|
- Match the following Column A to Column B
Text Solution
|
- The inequation represented by the graph given below is : <img src="htt...
Text Solution
|
- The inequation that best describes the graph given below is <img src=...
Text Solution
|
- The inequation that best describes the following graph is <img src="h...
Text Solution
|
- A car is moving on a straight road covers one third of the distance wi...
Text Solution
|
- 20 km/h की चाल से गतिशील किसी कार की चाल 6 s में 60 km/h हो जाती है...
Text Solution
|
- एक कार दो स्थानों के बीच की आधी दुरी 40 किमी/घंटा की चाल से तथा शेष आध...
Text Solution
|