A
B
C
D
Text Solution
Verified by Experts
The correct Answer is:


Similar Questions
Explore conceptually related problems
Recommended Questions
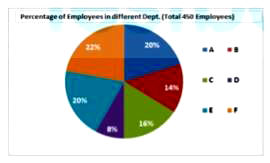
- The given pie chart shows the percentage distribution of 450 employees...
Text Solution
|
- Match the following Column A to Column B
Text Solution
|
- The inequation represented by the graph given below is : <img src="htt...
Text Solution
|
- The inequation that best describes the graph given below is <img src=...
Text Solution
|
- The inequation that best describes the following graph is <img src="h...
Text Solution
|
- In the given pie chart if the total employees are 450 and female emplo...
Text Solution
|
- In the given pie chart what is the central angle of the sector represe...
Text Solution
|
- Study the pie chart and answer the question IF 80% of the number ...
Text Solution
|
- Study the pie chart and answer the question The number of employe...
Text Solution
|