A
B
C
D
Text Solution
Verified by Experts
The correct Answer is:


Similar Questions
Explore conceptually related problems
Recommended Questions
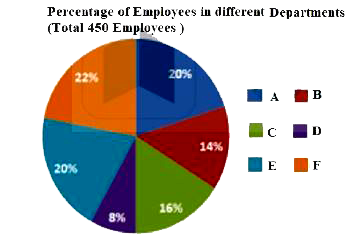
- The given pie chart shows the percentage distribution of 450 employees...
Text Solution
|
- Study the pie chart and table given below and answer the questions De...
Text Solution
|
- In the given pie chart if the total employees are 450 and female emplo...
Text Solution
|
- In the given pie chart what is the central angle of the sector represe...
Text Solution
|
- Study the pie chart and answer the question Distribution of the number...
Text Solution
|
- Study the pie chart and answer the question The total number of e...
Text Solution
|
- Study the pie chart and answer the question IF 80% of the number ...
Text Solution
|
- Study the pie chart and answer the question The number of employe...
Text Solution
|
- दिए गए पाई चार्ट में, विभाग A में काम करने वाले कर्मचारियों की संख्या ...
Text Solution
|