A
B
C
D
Text Solution
Verified by Experts
The correct Answer is:


Similar Questions
Explore conceptually related problems
Recommended Questions
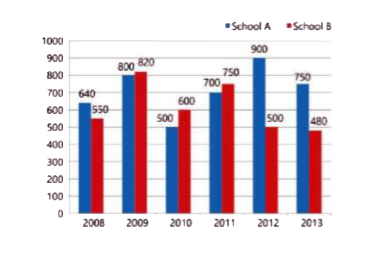
- The given bar graph shows the number of students of two schools over a...
Text Solution
|
- The inequation represented by the graph given below is : <img src="htt...
Text Solution
|
- The inequation that best describes the graph given below is <img src=...
Text Solution
|
- The inequation that best describes the following graph is <img src="h...
Text Solution
|
- The given Bar graph presents the number of students of two schools for...
Text Solution
|
- In given bar graph presents the number of students of two schools for ...
Text Solution
|
- The given bar graph (bar graph) shows the number of students in two sc...
Text Solution
|
- The given bar graph shows the number of students in two schools during...
Text Solution
|
- दिया गया दंड आरेख (बार ग्राफ) विभिन्न वर्षो में एक स्कूल के विज्ञान और...
Text Solution
|