A
B
C
D
Text Solution
Verified by Experts
The correct Answer is:


Similar Questions
Explore conceptually related problems
Recommended Questions
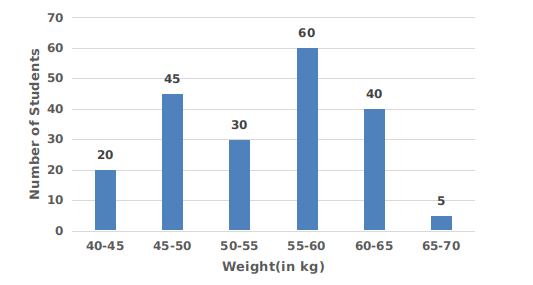
- The following histogram shows the weights of students of class X in a ...
Text Solution
|
- किसी कक्षा में 150 विघार्थियों का माध्य बजन 60 kg है| कक्षा में लड़कों ...
Text Solution
|
- The mean weight of 150 students in a class is 60 kg. the mean weight o...
Text Solution
|
- एक कक्षा में छात्रों का औसत भार 55 किग्ना. है । उसी कक्षा में छात्राओं...
Text Solution
|
- The following histogram shows the weight of the students of class X in...
Text Solution
|
- The given graph shows the weights of students in a school on a particu...
Text Solution
|
- The given graph shows the weights of students in a school on a particu...
Text Solution
|
- The following diagram shows the weight of the students of a school on ...
Text Solution
|
- In a class of 52 students the number of boys is 2 less than the number...
Text Solution
|