Home
Class 14
MATHS
The given pie-chart depicts the percenta...

The given pie-chart depicts the percentage of students coming to school using different modes of transport. Total number of students=1300
दिया गया पाई चार्ट परिवहन के विभिन्न साधनों का प्रयोग करके विद्यालय आने वाले छात्रों का प्रतिशत दर्शाता है | छात्रों की कुल संख्या =1300
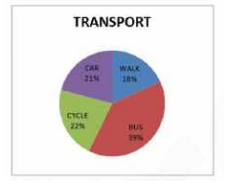
In the given pie-chart, if 234 students used to walk, then how many come by bus ? /
दिए गए पाई-चार्ट में, यदि 234 छात्र चलकर आते हैं, तो कितने छात्र बस से आते हैं?

A

507

B

286

C

273

D

432

Text Solution

Verified by Experts

The correct Answer is:
A
Promotional Banner

Similar Questions

Explore conceptually related problems

The given pie-chart depicts the percentage of students coming to school using different modes of transport. Total number of students=1300 दिया गया पाई चार्ट परिवहन के विभिन्न साधनों का प्रयोग करके विद्यालय आने वाले छात्रों का प्रतिशत दर्शाता है | छात्रों की कुल संख्या =1300 In the given pie-chart, the difference between the number of students travel by bus or walk to the number of students travel by car or cycle, इस पाई चार्ट के अनुसार बस सेया पैदल यात्रा करने वाले छात्रों की संख्या एवं कार अथवा साइकिल से यात्रा करने वाले छात्रों की संख्या में क्या अंतर है ?

The given pie chart depicts the percentage of students coming to school using different modes of transport. Total number of students =1300 In the given pie chart the percentage difference between students coming by car and bus to coming by walking and cycling.

The given pie-chart favourite sport of students of a school. दिया गया पाई चार्ट एक विद्यालय के छात्रों के पसंदीदा खेल को दर्शाता है | In the given pie-chart, if there were 1280 students in all, how many liked football? इस पाई चार्ट के अनुसार, यदि कुल मिलाकर 1280 छात्र हैं, तो फुटबॉल कितने छात्रों को पसंद है ?

The given pie-chart favourite sport of students of a school. दिया गया पाई चार्ट एक विद्यालय के छात्रों के पसंदीदा खेल को दर्शाता है | In the given pie-chart, if the school strength was 2500, how many liked cricket more than hockey? इस पाई चार्ट के अनुसार, यदि विद्यालय में कुल 2500 छात्र थे , तो कितने छात्र क्रिकेट को हॉकी से ज्यादा पसंद करते थे ?

The given pie-chart shows favourite sport of students of a school. In the given pie-chart, if there were 1280 students in all, how many liked football?

The given pie chart shows favorite shows of student of a school In the given pie chart, if there were 1280 students in all, how many liked football

The given pie-chart, shows the percentage distribution of the expenditure incurred in publishing a book. Study the pie-chart and the answer the question based on it. / दिया गया पाई चार्ट किसी पुस्तक के प्रकाशन में हुए व्ययों के प्रतिशत वितरण को दर्शाता है | इस पाई चार्ट का अध्ययन करें तथा इस पर आधारित प्रश्न का उत्तर दें | In the given pie-chart, by what percentage the Royalty on the book is less than the Printing cost? / दिए गए पाई चार्ट के अनुसार, इस पुस्तक पर रॉयल्टी प्रकाशन की लागत से कितना प्रतिशत कम है ?

The given pie chart shows the percentage of students enrolled for the courses A, B, C, D and E in a university and the table shows the percentage of students that passed, out of the enrolled students. दिया गया पाई चार्ट एक विश्वविद्यालय में पाठ्यक्रम A, B, C, D और E के लिए नामांकित छात्रों के प्रतिशत को दर्शाता है और तालिका उन छात्रों का प्रतिशत दिखाती है, जो नामांकित छात्रों में से उत्तीर्ण हुए हैं। If the total number of students is 60000, then the total number of students who did not pass in the courses A, C is: यदि छात्रों की कुल संख्या 60000 है, तो कुल छात्रों की संख्या, जो पाठ्यक्रम A, C में उत्तीर्ण नहीं हुए हैं:

The following pie chart shows the percentage-wise distribution of the number of students in five different schools P, Q, R, S and T. The total number of students in all five schools together is 8400. निम्नलिखित पाई चार्ट पांच अलग-अलग स्कूलों P, Q, R, S और T में छात्रों की संख्या के प्रतिशत को दर्शाता है। सभी पाँच स्कूलों में कुल छात्रों की संख्या 8400 है Find the average number of students in schools R and S together. स्कूलों R और S में एक साथ छात्रों की औसत संख्या ज्ञात कीजिए।