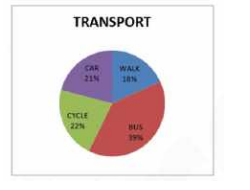
 In the given pie-chart, the difference between the number of students travel by bus or walk to the number of students travel by car or cycle,
 A
B
C
D
Text Solution
Verified by Experts
The correct Answer is:


Similar Questions
Explore conceptually related problems
Recommended Questions
- The given pie-chart depicts the percentage of students coming to schoo...
Text Solution
|
- The given pie-chart depicts the percentage of students coming to schoo...
Text Solution
|
- The given pie-chart depicts the percentage of students coming to schoo...
Text Solution
|
- The given pie-chart favourite sport of students of a school. दिया गया ...
Text Solution
|
- The given pie-chart favourite sport of students of a school. दिया गया ...
Text Solution
|
- The given pie-chart favourite sport of students of a school. दिया गया ...
Text Solution
|
- The Table shows the number of students from different schools playing ...
Text Solution
|
- The given pie chart shows the percentage of students enrolled for the ...
Text Solution
|
- The following pie chart shows the percentage wise distribution of the ...
Text Solution
|