A
B
C
D
Text Solution
Verified by Experts
The correct Answer is:


Recommended Questions
- The table given below shows the number of students studying in five co...
Text Solution
|
- Match the following Column A to Column B
Text Solution
|
- The inequation represented by the graph given below is : <img src="htt...
Text Solution
|
- The inequation that best describes the graph given below is <img src=...
Text Solution
|
- No. of students and % of students passed out of those who appeared are...
Text Solution
|
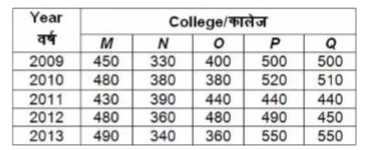
- The table below shows the number of students enrolled in five colleges...
Text Solution
|
- This table shows the percentage of students passing out of five differ...
Text Solution
|
- The following table shows the number of students in five colleges in t...
Text Solution
|
- This table shows the pass percentage of three year students from five ...
Text Solution
|