A
B
C
D
Text Solution
Verified by Experts
The correct Answer is:


Similar Questions
Explore conceptually related problems
Recommended Questions
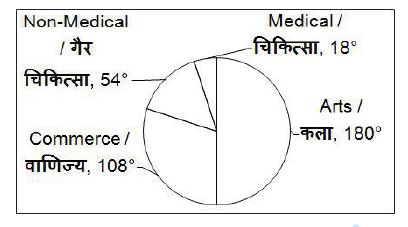
- The given pie chart shows the stream wise distribution (in degrees) of...
Text Solution
|
- Match the following Column A to Column B
Text Solution
|
- The inequation represented by the graph given below is : <img src="htt...
Text Solution
|
- The inequation that best describes the graph given below is <img src=...
Text Solution
|
- In the recently conducted TAS examination , 15% of the candidates ...
Text Solution
|
- In an exam 49% candidates failed in English and 36% failed in Hindi an...
Text Solution
|
- The total surface area of the given solid figure is .
Text Solution
|
- In an exam 49% candidates failed in English and 36% failed in Hindi an...
Text Solution
|
- The table given below shows the number of candidates enrolled in the e...
Text Solution
|