A
B
C
D
Text Solution
Verified by Experts
The correct Answer is:


Similar Questions
Explore conceptually related problems
Recommended Questions
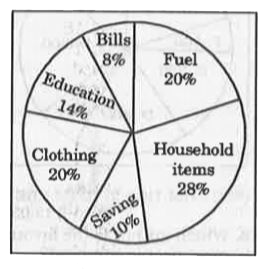
- The given pie chart shows the monthly expenditure on various items and...
Text Solution
|
- Match the following Column A to Column B
Text Solution
|
- The inequation represented by the graph given below is : <img src="htt...
Text Solution
|
- Directions : The pie-chart given below shows expenditure incurred by a...
Text Solution
|
- संलग्न पाई चार्ट किसी आदमी के विभिन्न मदों में किए गए मासिक खर्च को दर...
Text Solution
|
- एक परिवार का मासिक व्यय, मासिक आय का 60% है। यदि वह परिवार रु 6,000 प्...
Text Solution
|
- Monthly income of a family is Rs 12,000. is. The monthly expenditure o...
Text Solution
|
- The pie-chart given below shows the distribution of monthly expenditur...
Text Solution
|
- The following are the household monthly expenditure (in percentage) on...
Text Solution
|