A
B
C
D
Text Solution
Verified by Experts
The correct Answer is:


Similar Questions
Explore conceptually related problems
Recommended Questions
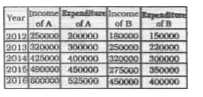
- The table given below shows the income and expenditure (in Rs.) of two...
Text Solution
|
- Per cent Profit =("Income-Expenditure")/("Expenditure")xx100 If i...
Text Solution
|
- Per cent Profit =("Income-Expenditure")/("Expenditure")xx100 If t...
Text Solution
|
- Per cent Profit =("Income-Expenditure")/("Expenditure")xx100 What...
Text Solution
|
- Per cent Profit =("Income-Expenditure")/("Expenditure")xx100 If i...
Text Solution
|
- Per cent Profit =("Income-Expenditure")/("Expenditure")xx100 Wha...
Text Solution
|
- Expenditure of company 'B' in 2012 was 90% of its expenditure in 2011...
Text Solution
|
- The table shows income and expenditure of a person for 3 years In the ...
Text Solution
|
- Income and Expenditure of a Tire Company (Rs. in Crores) In which year...
Text Solution
|