A
B
C
D
Text Solution
Verified by Experts
The correct Answer is:


Similar Questions
Explore conceptually related problems
Recommended Questions
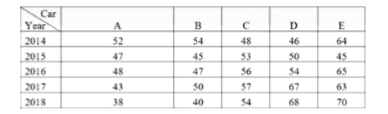
- The table shows the production of different types of cars by a company...
Text Solution
|
- The table shows the production of different types of cars (in thousand...
Text Solution
|
- Average production of Type D cars in 5 years is what percent less than...
Text Solution
|
- The table shows the production of different types of cars (in thousand...
Text Solution
|
- The table shows the production of different types of cars by a company...
Text Solution
|
- The following table shows the production (in thousands) of different t...
Text Solution
|
- This table by a company 5 Shows the production (in thousands) of diffe...
Text Solution
|
- यह तालिका किसी कम्पनी द्वारा 5 वर्षो में विभिन्न प्रकार की कारों के उत...
Text Solution
|
- तालिका में विभिन्न प्रकार की कारों के उत्पादन को (हजारों में ) दर्शाया...
Text Solution
|