A
B
C
D
Text Solution
Verified by Experts
The correct Answer is:


Similar Questions
Explore conceptually related problems
Recommended Questions
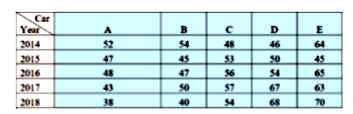
- The table shows the production of different types of cars by a company...
Text Solution
|
- The table shows the production of different types of cars by a company...
Text Solution
|
- सभी पांच वर्षो में टाइप B कारो का कुल उत्पादन 2017 में टाइप A, B और D ...
Text Solution
|
- The table shows the production of different types of cars by a company...
Text Solution
|
- The table shows the production of different types of cars by a company...
Text Solution
|
- यह तालिका किसी कम्पनी द्वारा 5 वर्षो में विभिन्न प्रकार की कारों के उत...
Text Solution
|
- यह तालिका किसी कम्पनी द्वारा 5 वर्षो में विभिन्न प्रकार की कारों के उत...
Text Solution
|
- तालिका में विभिन्न प्रकार की कारों के उत्पादन को (हजारों में ) दर्शाया...
Text Solution
|
- तालिका में विभिन्न प्रकार की कारों के उत्पादन को (हजारों में ) दर्शाया...
Text Solution
|