A
B
C
D
Text Solution
Verified by Experts
The correct Answer is:


Similar Questions
Explore conceptually related problems
Recommended Questions
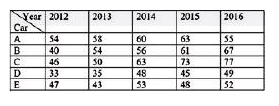
- The table shows the production of different types of cars (in thousand...
Text Solution
|
- The table shows the production of different types of cars (in thousand...
Text Solution
|
- The table shows the production of different types of cars (in thousand...
Text Solution
|
- The table shows the production of different types of cars (in thousand...
Text Solution
|
- The table shows the production of different types of cars. (in thousan...
Text Solution
|
- The following table shows the production (in thousands) of different t...
Text Solution
|
- तालिका में विभिन्न प्रकार की कारों के उत्पादन को (हजारों में ) दर्शाया...
Text Solution
|
- The table shows the production (in thousands) of different types of ca...
Text Solution
|
- The table shows the production (in thousands) of different types of ca...
Text Solution
|