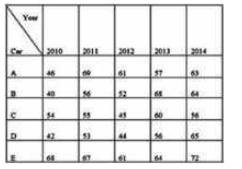
 The average production of all type of cars in 2014 is approximately what percent less than the total production of type B cars in 2013 and type D cars in
2010 taken together?
The average production of all type of cars in 2014 is approximately what percent less than the total production of type B cars in 2013 and type D cars in
2010 taken together? A
B
C
D
Text Solution
Verified by Experts
The correct Answer is:


Similar Questions
Explore conceptually related problems
Recommended Questions
- The table shows the production of different types of cars (in thousand...
Text Solution
|
- The table shows the production of different types of cars (in thousand...
Text Solution
|
- The table shows the production of different types of cars (in thousand...
Text Solution
|
- The table shows the production of different types of cars (in thousand...
Text Solution
|
- The table shows the production of different types of cars (in thousand...
Text Solution
|
- The table shows the production of different types of cars (in thousand...
Text Solution
|
- The table shows the production of different types of cars (in thousand...
Text Solution
|
- The table shows the production of different types of cars (in thousand...
Text Solution
|
- The table shows the production of different types of cars (in thousand...
Text Solution
|