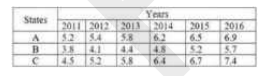
 If the data related to the total production in all three states over these six years is represented in a pie chart, then what will be the central angle of the sector representing the year 2014 ? ( to the nearest whole number )
 A
B
C
D
Text Solution
Verified by Experts
The correct Answer is:


Similar Questions
Explore conceptually related problems
Recommended Questions
- Table shows the production of rice (in million tonnes) of three states...
Text Solution
|
- Determine the point of symmetry of a regular hexagon. <img src="htt...
Text Solution
|
- Match the following Column A to Column B
Text Solution
|
- The inequation represented by the graph given below is : <img src="htt...
Text Solution
|
- The table shows the production of different types of cars (in thousand...
Text Solution
|
- The table shows the production of different types of cars (in thousand...
Text Solution
|
- Table shows the production of rice (in million tonnes) of three states...
Text Solution
|
- Table shows the production of rice (in million tonnes) of three states...
Text Solution
|
- The table shows the number of cars sold by three showrooms over a peri...
Text Solution
|