A
B
C
D
Text Solution
Verified by Experts
The correct Answer is:


Similar Questions
Explore conceptually related problems
Recommended Questions
- This table shows the percentage of students passing out of five differ...
Text Solution
|
- No. of students and % of students passed out of those who appeared are...
Text Solution
|
- The table below shows the number of students enrolled in five colleges...
Text Solution
|
- This table shows the percentage of students passing out of five differ...
Text Solution
|
- This table shows the percentage of students passing out of five differ...
Text Solution
|
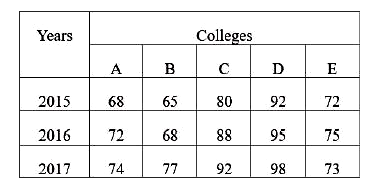
- This table shows the pass percentage of three year students from five ...
Text Solution
|
- निम्नलिखित तालिका में पिछले पाँच वर्षो ( 2010 से 2014 ) में पाँच कॉलेज...
Text Solution
|
- यह तालिका तीन वर्ष के दौरान पाँच अलग - अलग कॉलेजों के उत्तीर्ण विद्यार...
Text Solution
|
- यह तालिका तीन वर्ष के दौरान पाँच अलग - अलग कॉलेजों के उत्तीर्ण विद्यार...
Text Solution
|