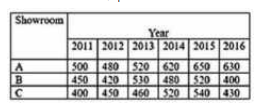
 By what percent did the total number of cars sold by all three showrooms decrease during the year 2016, as compared to that in the year 2015 (nearest to one decimal place)?
 A
B
C
D
Text Solution
Verified by Experts
The correct Answer is:


Recommended Questions
- The table shows the number of cars sold by three showrooms over a peri...
Text Solution
|
- The table shows the production of different types of cars (in thousand...
Text Solution
|
- The table shows the production of different types of cars (in thousand...
Text Solution
|
- The table shows the number of cars sold by three showrooms over a peri...
Text Solution
|
- The table shows the number of cars sold by three showrooms over a peri...
Text Solution
|
- The table shows the number of cars sold by three showrooms over a peri...
Text Solution
|
- The given table represents the sale (in thousands) of cars by four com...
Text Solution
|
- The given table represents the sale (in thousands) of cars by four com...
Text Solution
|
- The table shows the number of cars sold by three showrooms over a peri...
Text Solution
|