A
B
C
D
Text Solution
Verified by Experts
The correct Answer is:


Similar Questions
Explore conceptually related problems
Recommended Questions
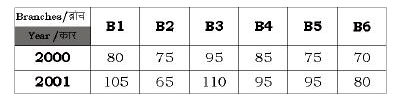
- Table shows the sales of books from six branches of a publishing compa...
Text Solution
|
- Table shows the sales of book (in thousands) from six branches of a pu...
Text Solution
|
- The given Bar Graph present the sales of the number of books (in thous...
Text Solution
|
- Table shows the sales of books from six branches of a publishing compa...
Text Solution
|
- The given Bar Graph present the sales of the number of books (in thous...
Text Solution
|
- The given bar chart shows the sales of books from six branches of a pu...
Text Solution
|
- The given bar chart shows the sales of books from six branches of a pu...
Text Solution
|
- The given bar chart shows the sales of books from six branches of a pu...
Text Solution
|
- The table shows the number of books (in thousand) sold in the years 20...
Text Solution
|