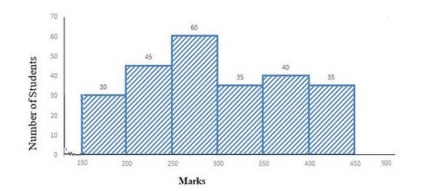
 The number of students who obtained less than 300 marks is what percent more than the number of students who obtained 350 or more marks?
A
B
C
D
Text Solution
Verified by Experts
The correct Answer is:


Similar Questions
Explore conceptually related problems
Recommended Questions
- The given graph shows the marks obtained by students in an examination...
Text Solution
|
- दिए गए चित्र में पाँच विद्यालयों में वर्ग 9 की परीक्षा में 80% से अधिक...
Text Solution
|
- The given graph shows the marks obtained by students in an examination...
Text Solution
|
- The given graph shows the marks obtained by students in an examination...
Text Solution
|
- The given graph shows the marks obtained by students in an examination...
Text Solution
|
- Study the given graph and answer the question that follows The to...
Text Solution
|
- The given graph shows the marks obtained by the students in an examina...
Text Solution
|
- In each of the following questions, the following histogram shows the ...
Text Solution
|
- Distribution of marks of students in an examination 50 Total number of...
Text Solution
|