Home
Class 14
MATHS
The given pie chart shows the quantity w...

The given pie chart shows the quantity wise sales distribution of five products (A, B, C, D and E) of a company in 2016.
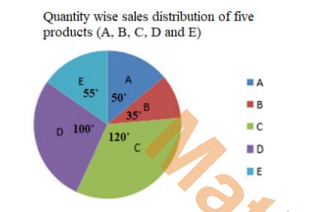
In 2016, if a total of 14616 units were sold, then the number of units of products D sold was:

A

4263

B

4060

C

4872

D

4096

Text Solution

Verified by Experts

The correct Answer is:
B
Promotional Banner

Similar Questions

Explore conceptually related problems

The given pie chart shows the quantity wise sales distribution of five products (A, B, C. D and E) of a company in 2016. If 320 units of product A were sold by the company, then how many units of products B and E together were sold by the company”?

The given pie chart shows the quantity wise sales distribution of five products (A, B, C, D and E) of a company in 2016. If 1500 units of product D were sold in 2016 and the total number of units sold by the company in 2017 was 18% more than that sold in 2016, then the total units sold by the company in 2017 is:

The given pie chart shows the quantity wise sales distribution of five products (A B C D E) of a company in 2016 If 1500 units of products D were sold in 2016 and the total number of units sold by the company in 2017 was 18% more than that sold in 2016, then the total units sold by the company in 2017 is:

The given pie chart shows the quantity wise sales distribution of five products (A, B, C, D and E) of a company in 2016. दिया गया पाई चार्ट 2016 में एक कंपनी के पाँच उत्पादों ( A, B, C, D और E ) की मात्रा वार बिक्री का वितरण दर्शाता है | If 1500 units of product D were sold in 2016 and the total number of units sold by the company in 2017 was 18% more than that sold in 2016, then the total units sold by the company in 2017 is: यदि 2016 में वस्तु D की 1500 इकाइयाँ बेचीं गयीं और 2017 में कंपनी द्वारा बेचीं गयी इकाइयों की कुल संख्या 2016 में बेचीं गयी इकाइयों की कुल संख्या से 18% अधिक थी, तो 2017 में कंपनी द्वारा बेची गयी कुल इकाइयों की संख्या है

The given pie chart shows the quantity wise sales distribution of five products (A, B, C, D and E) of a company in 2016. दिया गया पाई चार्ट 2016 में एक कंपनी के पाँच उत्पादों ( A, B, C, D और E ) की मात्रा वार बिक्री का वितरण दर्शाता है | If 320 units of product A were sold by the company, then how many units of products B and E together were sold by the company? यदि कंपनी के द्वारा वस्तु A की 320 इकाइयाँ बेची गयीं , तो कंपनी के द्वारा बेची गयी वस्तु B और E की कुल इकाइयों की संख्या ज्ञात करें |