Home
Class 14
MATHS
The given graph shows the weights of stu...

The given graph shows the weights of students in a school on a particular day.
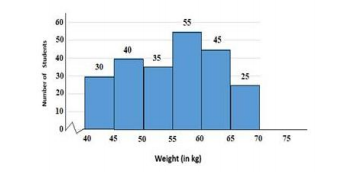
The number of students weighing less than 50 kg is what per cent less than the number of students weighing 55 kg or more?

A

`40`

B

`55`

C

`30`

D

`44`

Text Solution

Verified by Experts

The correct Answer is:
D
Promotional Banner

Similar Questions

Explore conceptually related problems

The given graph shows the weights of students in a school on a particular day. The number of students weighing less than 50kg is what percent less than the number of students weighing 55kg or more?

The given graph shows the marks obtained by students in an examination. The number of students who obtained less than 300 marks is what percent more than the number of students who obtained 350 or more marks?

The given graph shows the marks obtained by students in an examination The number of students who obtained less than 300 marks is what percent more than the number of students who obtained 350 or more marks

The following histogram shows the weights of students of class X in a school on a particular day. Total number of students enrolled in class X = 200. The number of students weighing less than 55 kg is what percentage less than the number of students weighing 55 kg to 65 kg?

The given histogram shows the height of the students. The number of students whose height is in the class interval 165-170 is what percentage less than the number of students whose height is in the interval 150- 155? (correct to one decimal place)

The given histogram shows the height of the students The number of students whose height is in the class interval 170-175 is what percent less than the number of students whose height is in the interval 165-170 ? (correct to one decimal place)

Study the given graph and answer the question that follows The total marks of students obtaining less than 50 marks is what percentage more than the total number of students obtaining 60 marks or more

Study the given graph the question that follows The number of students is school C is what percentage more than the number of students in school B?

The following histogram shows the weight of the students of class X in a school on a particular day. Total number of students enrolled in the class X = 200. निम्नलिखित हिस्टोग्राम किसी एक दिन पर एक स्कूल में दसवीं कक्षा के छात्रों के वजन को दर्शाता है। कक्षा - 200 में नामांकित कुल छात्र। The number of students weighing less than 55kg is what percentage less than the number of students weighing 55kg to 65kg? 55 किग्रा से कम वजन वाले छात्रों की संख्या 55 किग्रा से किग्रा तक वाले छात्रों की संख्या से कितने प्रतिशत काम है ज्ञात करे |

Study the given pie chart and answer the question that follows The total number of students in schools D and E is what percentage more than the number of students in schools B and C?