A
B
C
D
Text Solution
Verified by Experts
The correct Answer is:


Similar Questions
Explore conceptually related problems
Recommended Questions
- Study the given graph and asnwer the question that follows. The n...
Text Solution
|
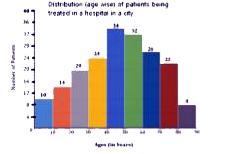
- The digram shows the age distribution of the patients admitted to a ho...
Text Solution
|
- Match the following Column A to Column B
Text Solution
|
- The inequation represented by the graph given below is : <img src="htt...
Text Solution
|
- The inequation that best describes the graph given below is <img src=...
Text Solution
|
- The inequation that best describes the following graph is <img src="h...
Text Solution
|
- Following are the ages (in years) of 360 patients , getting medical tr...
Text Solution
|
- The following table shows ages of 200 patients (in years) and the num...
Text Solution
|
- अग्रलिखित सारणी में एक शहर में एक विशेष वर्ष में एक रोग से पीड़ित रोगिय...
Text Solution
|