A
B
C
D
Text Solution
Verified by Experts
The correct Answer is:


Similar Questions
Explore conceptually related problems
Recommended Questions
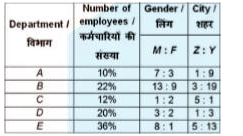
- The given table shows the number (in percent) of employees working in ...
Text Solution
|
- The following table shows the household expenditure of employees in a ...
Text Solution
|
- The given table shows the number (in percent) of employees working in ...
Text Solution
|
- The given table shows the number (in percent) of employees working in ...
Text Solution
|
- The given table shows the number (in percent) of employees working in ...
Text Solution
|
- The given pie chart shows the breakup of total number of the employees...
Text Solution
|
- Study the pie-chart and table given below and answer the questions. ...
Text Solution
|
- The given circle diagram shows the break-up of the number of employees...
Text Solution
|
- The given table shows the number (in percent) of employees working in ...
Text Solution
|