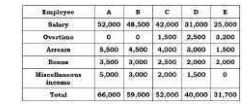
 How many employees have their salary more than four times their other income?
 A
B
C
D
Text Solution
Verified by Experts
The correct Answer is:


Recommended Questions
- The table below shows income (in rupees) for a particular month, toget...
Text Solution
|
- Match the following Column A to Column B
Text Solution
|
- The inequation represented by the graph given below is : <img src="htt...
Text Solution
|
- The inequation that best describes the graph given below is <img src=...
Text Solution
|
- The given table shows the number (in percent) of employees working in ...
Text Solution
|
- The income of A is 25% more than that of B and the income of C is 65% ...
Text Solution
|
- The income of A is 50% more than that of B. If the income of A is incr...
Text Solution
|
- The sum of incomes of A and B is 165000. A spends 70% of his income an...
Text Solution
|
- Rita.s income is 15% less than Richa.s income. By what percent is Rich...
Text Solution
|