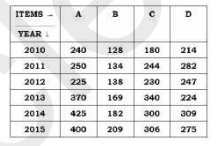
 The total exports of item D in 2010, 2012 and 2014 is what percentage of the total exports of all the four items in 2011 and 2012?
 A
B
C
D
Text Solution
Verified by Experts
The correct Answer is:


Recommended Questions
- The given table represents the exports (in ₹ crores) of four items A,B...
Text Solution
|
- The given table represents the number of engineers recruited by four c...
Text Solution
|
- The given table represents the number of engineers recruited by four c...
Text Solution
|
- The given table represents the number of engineers recruited by four c...
Text Solution
|
- The given table represents the number of engineers recruited by four c...
Text Solution
|
- The given table represents the number of computers sold by four dealer...
Text Solution
|
- The given table represents the number of computers sold by four dealer...
Text Solution
|
- The given table represents the number of computers sold by four dealer...
Text Solution
|
- The given table represents the number of computers sold by four dealer...
Text Solution
|