 What is the ratio of total number of cars sold by companies A,B and D in 2017 to the total number
of cars sold by all companies in 2018?
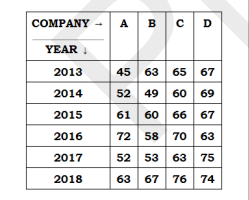
What is the ratio of total number of cars sold by companies A,B and D in 2017 to the total number
of cars sold by all companies in 2018? A
B
C
D
Text Solution
Verified by Experts
The correct Answer is:


Recommended Questions
- The given table represents the sale (in thousands) of cars by four com...
Text Solution
|
- The table shows the number of cars sold by three showrooms over a peri...
Text Solution
|
- The given table shows the number (in thousands) of cars of five differ...
Text Solution
|
- The given table represents the number of engineers recruited by four c...
Text Solution
|
- The given table represents the number of engineers recruited by four c...
Text Solution
|
- The given table represents the number of engineers recruited by four c...
Text Solution
|
- The given table represents the number of engineers recruited by four c...
Text Solution
|
- The given table represents the number of computers sold by four dealer...
Text Solution
|
- The given table represents the number of computers sold by four dealer...
Text Solution
|