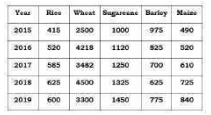
 The average production of wheat (in tonnes) in the period given in the table is:
 A
B
C
D
Text Solution
Verified by Experts
The correct Answer is:


Recommended Questions
- In the following table, the production of various crops (in tonnes) is...
Text Solution
|
- Match the following Column A to Column B
Text Solution
|
- The inequation represented by the graph given below is : <img src="htt...
Text Solution
|
- The inequation that best describes the graph given below is <img src=...
Text Solution
|
- The inequation that best describes the following graph is <img src="h...
Text Solution
|
- The average Kharif production of the given years is- दिए गए वर्षों में...
Text Solution
|
- The given table shows the number (in thousands) of cars of five differ...
Text Solution
|
- The given table represents the number of engineers recruited by four c...
Text Solution
|
- The given table represents the number of engineers recruited by four c...
Text Solution
|