A
B
C
D
Text Solution
Verified by Experts
The correct Answer is:


Recommended Questions
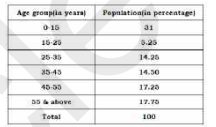
- The following table showing the percentage of the total population of ...
Text Solution
|
- Match the following Column A to Column B
Text Solution
|
- The inequation represented by the graph given below is : <img src="htt...
Text Solution
|
- The inequation that best describes the graph given below is <img src=...
Text Solution
|
- Age of A is 6 years more than three times the age of B. After three ye...
Text Solution
|
- In a school, 5/12 of the number of students are girls and the rest are...
Text Solution
|
- The table shows the production of different types of cars (in thousand...
Text Solution
|
- The table shows the production of different types of cars (in thousand...
Text Solution
|
- The table shows the production of different types of cars (in thousand...
Text Solution
|