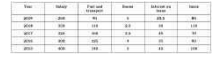
 What is the average amount of interest per year which the company had to pay during this
period?
What is the average amount of interest per year which the company had to pay during this
period? A
B
C
D
Text Solution
Verified by Experts
The correct Answer is:


Recommended Questions
- The following table shows the items of expenditure of a company (in ₹ ...
Text Solution
|
- Match the following Column A to Column B
Text Solution
|
- The inequation that best describes the following graph is <img src="h...
Text Solution
|
- The following line diagram represents the yearly sales figure of a com...
Text Solution
|
- The given bar graph presents the number of different types of vehicles...
Text Solution
|
- The given Bar Graph presents Income and Expenditure (in crores of Rupe...
Text Solution
|
- The given Bar Graph presents Income and Expenditure (in crores of Rupe...
Text Solution
|
- The given Bar Graph presents Income and Expenditure (in crores of Rupe...
Text Solution
|
- The given Bar Graph presents Income and Expenditure (in crores of Rupe...
Text Solution
|