A
B
C
D
Text Solution
Verified by Experts
The correct Answer is:


Recommended Questions
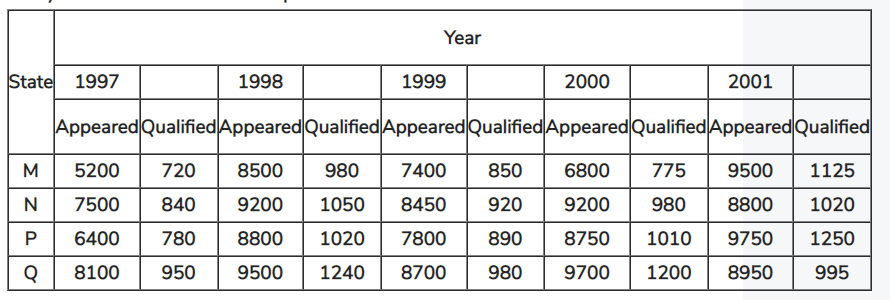
- Direction: The following table represents the number of candidates tha...
Text Solution
|
- Formation of table for the appeared and qualified candidates in differ...
Text Solution
|
- Match the following Column A to Column B
Text Solution
|
- The inequation represented by the graph given below is : <img src="htt...
Text Solution
|
- The inequation that best describes the following graph is <img src="h...
Text Solution
|
- Study the following table and answer the questions. The differenc...
Text Solution
|
- The following table represents the number of candidates that appeared ...
Text Solution
|
- What is the difference between the number of candidates qualifying in ...
Text Solution
|
- निम्नलिखित तालिका का अध्ययन करें और दिए गए सवाल का जवाब दें ये तालिक...
Text Solution
|