A
B
C
D
Text Solution
Verified by Experts
The correct Answer is:


Similar Questions
Explore conceptually related problems
Recommended Questions
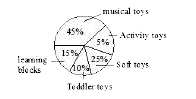
- The following pie chart shows information on sales of a toy making com...
Text Solution
|
- The value of |[a,a+d,a+2d] , [a+d,a+2d,a+3d] , [a+2d,a+3d,a+4d]|+|[b,b...
Text Solution
|
- The correct order of size among Br^(+), Br, Br^(-)
Text Solution
|
- एक कम्पनी A और B कि दो प्रकार के खिलौने बनाती है खिलौना A को काटकर आका...
Text Solution
|
- निम्नलिखित अभिक्रिया के अनुक्रम मे X तथा Y को पहचानिये। R-CONH(2)ov...
Text Solution
|
- 1) Fragmentation () a) Planaria br 2) Unripe fruits () b) Yeast br 3) ...
Text Solution
|
- వేర్ల ద్వారా శాఖీయోత్పత్తి జరిపే మొక్కbr i) డాలియాbr ii) ముల్లంగ...
Text Solution
|
- निम्न अभिक्रिया में X व Y को पहचानिए: underset(" Br")underset("...
Text Solution
|
- Find correct features w.r.t. most advanced type of placentation. Br a....
Text Solution
|