A
B
C
D
Text Solution
Verified by Experts
The correct Answer is:


Similar Questions
Explore conceptually related problems
Recommended Questions
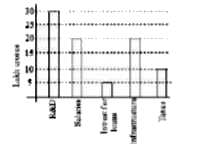
- The graph below shows the expenditure of a public sector company ‘ABC’...
Text Solution
|
- Fill in the blanks: 1 lakh = ... ten thousand 1 lakh = ... thousand...
Text Solution
|
- Ten millions equal to: 10 lakh (b) 1 crore (c) 10 cr...
Text Solution
|
- The value of |[a,a+d,a+2d] , [a+d,a+2d,a+3d] , [a+2d,a+3d,a+4d]|+|[b,b...
Text Solution
|
- Fill in the blanks: (a) 1 lakh = ten thousand (b) 1 million = hundred ...
Text Solution
|
- Fill in the blanks: 1 lakh = ... ten thousand 1 lakh = ... thousand...
Text Solution
|
- Ten millions equal to: 10 lakh (b) 1 crore (c) 10 cr...
Text Solution
|
- 1 crore= Lakhs.
Text Solution
|
- Fill in the blanks :1 crore = lakhs.
Text Solution
|