A
B
C
D
Text Solution
Verified by Experts
The correct Answer is:


Similar Questions
Explore conceptually related problems
Recommended Questions
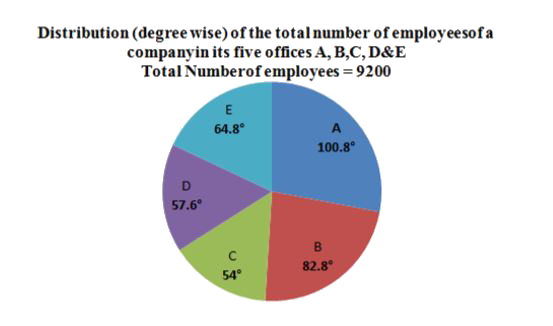
- Study the pie-chart and answer the question. Distribution (degree wi...
Text Solution
|
- The given pie chart shows the breakup of total number of the employees...
Text Solution
|
- The given pie chart shows the breakup of total number of the employees...
Text Solution
|
- The given pie chart shows the breakup of total number of the employees...
Text Solution
|
- The given pie chart shows the breakup of total number of the employees...
Text Solution
|
- Study the pie chart and answer the question. Distribution of the numbe...
Text Solution
|
- Study the pie chart and answer the question IF 50% of the employe...
Text Solution
|
- Study the pie chart and answer the question Total number of emplo...
Text Solution
|
- Study the pie chart and answer the question The total number of e...
Text Solution
|