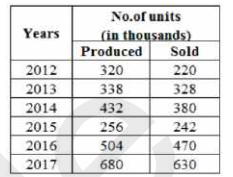
 Find the ratio of the total number of units sold in 2013 and 2015 to the number of units produced in
2015 and 2016?
Find the ratio of the total number of units sold in 2013 and 2015 to the number of units produced in
2015 and 2016? A
B
C
D
Text Solution
Verified by Experts
The correct Answer is:


Similar Questions
Explore conceptually related problems
Recommended Questions
- The table given below shows the number of units of a product produced ...
Text Solution
|
- Match the following Column A to Column B
Text Solution
|
- The inequation represented by the graph given below is : <img src="htt...
Text Solution
|
- The inequation that best describes the graph given below is <img src=...
Text Solution
|
- Study the given graph and answer the question that follows. Production...
Text Solution
|
- The given pie chart shows the quantity wise sales distribution of five...
Text Solution
|
- The given pie chart shows the quantity wise sales distribution of five...
Text Solution
|
- The table shows the number of cars sold by three showrooms over a peri...
Text Solution
|
- The table shows the number of cars sold by three showrooms over a peri...
Text Solution
|