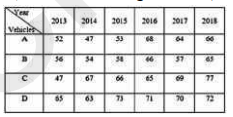
 In how many years is the production of type C vehicles, below the average production of type D vehicles over six years?
 A
B
C
D
Text Solution
Verified by Experts
The correct Answer is:


Similar Questions
Explore conceptually related problems
Recommended Questions
- The table given below presents the figures of the production (in thous...
Text Solution
|
- निर्देश :- निम्नलिखित ग्राफ में एक फैक्ट्री द्वारा वर्ष तक वाहन के दो ...
Text Solution
|
- निर्देश :- निम्नलिखित ग्राफ में एक फैक्ट्री द्वारा वर्ष तक वाहन के दो ...
Text Solution
|
- निर्देश :- निम्नलिखित ग्राफ में एक फैक्ट्री द्वारा वर्ष तक वाहन के दो ...
Text Solution
|
- The inequation represented by the graph given below is : <img src="htt...
Text Solution
|
- The inequation that best describes the graph given below is <img src=...
Text Solution
|
- The table given below presents the figures of the production (in thous...
Text Solution
|
- The following graph shows production (in thousands) of two types (P an...
Text Solution
|
- The following graph shows production (in thousands) of two types (P an...
Text Solution
|